| THE ELECTION OF THE MEMBERS OF THE EUROPEAN PARLIAMENT |
| 13 June 2004 |
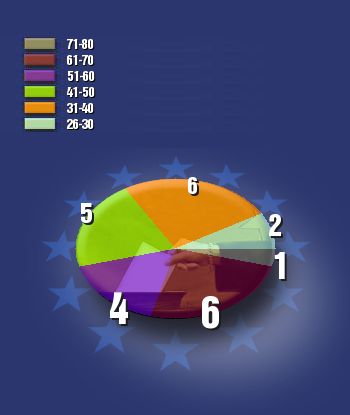
The age and gender composition of the Hungarian members of the European Parliament
| Age | Male | Female | Total |
| Total | 16 | 8 | 24 |
| Above 80 | 0 | 0 | 0 |
| 71-80 | 1 | 0 | 1 |
| 61-70 | 4 | 2 | 6 |
| 51-60 | 4 | 0 | 4 |
| 41-50 | 2 | 3 | 5 |
| 31-40 | 4 | 2 | 6 |
| 26-30 | 1 | 1 | 2 |
| Under 26 | 0 | 0 | 0 |
| Age composition | Gender composition |
 |
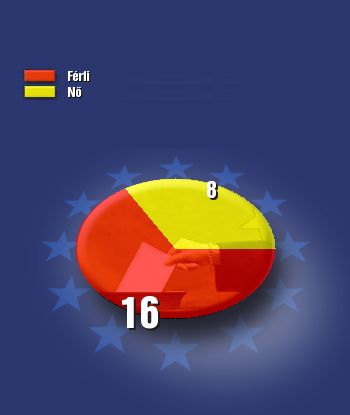 |
The red colour in the diagram represents the proportion of males, the yellow colour the proportion of females.