| Updated: 19:51 4.24.2010 | Round 1 of the Parliamentary Elections |  |
| April 11, 2010 |
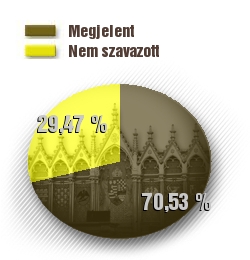
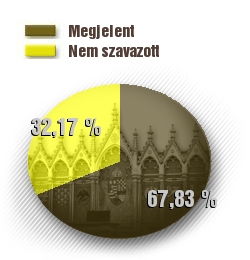
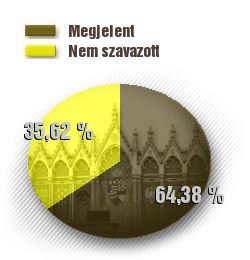
Comparative Data on Turnout until 7 p.m.
The exhibit contains comparative data on the turnout about the Parliamentary Elections at 2002,2006 and 2010
The brown colour in the diagram represents the proportion of those who have turned out at the elections and
the yellow colour the proportion of those who have not voted yet.
| Nationally | ||
| Parliamentary Elections 2002 - 1st round | Parliamentary Elections 2006 - 1st round | Parliamentary Elections 2010 - 1st round |
| 70,53 % | 67,83 % | 64,38 % |
 |
 |
 |
| Capital/county | Parliamentary Elections 2002 - 1st round | Parliamentary Elections 2006 - 1st round | Parliamentary Elections 2010 - 1st round |
| BUDAPEST | 77,52 % | 74,33 % | 69,74 % |
| BARANYA | 71,82 % | 68,00 % | 60,57 % |
| BÁCS-KISKUN | 64,95 % | 63,92 % | 61,88 % |
| BÉKÉS | 66,89 % | 64,26 % | 61,71 % |
| BORSOD-ABAÚJ-ZEMPLÉN | 68,03 % | 63,89 % | 61,19 % |
| CSONGRÁD | 67,33 % | 66,26 % | 62,14 % |
| FEJÉR | 69,61 % | 66,85 % | 64,46 % |
| GYŐR-MOSON-SOPRON | 73,89 % | 70,74 % | 65,76 % |
| HAJDÚ-BIHAR | 65,96 % | 64,66 % | 62,46 % |
| HEVES | 70,13 % | 66,52 % | 64,20 % |
| JÁSZ-NAGYKUN-SZOLNOK | 66,65 % | 62,58 % | 60,97 % |
| KOMÁROM-ESZTERGOM | 70,98 % | 67,68 % | 61,84 % |
| NÓGRÁD | 69,29 % | 67,05 % | 62,92 % |
| PEST | 70,60 % | 68,68 % | 66,50 % |
| SOMOGY | 67,96 % | 65,21 % | 61,29 % |
| SZABOLCS-SZATMÁR-BEREG | 65,83 % | 65,57 % | 63,22 % |
| TOLNA | 68,53 % | 66,61 % | 61,71 % |
| VAS | 74,17 % | 69,82 % | 66,43 % |
| VESZPRÉM | 72,61 % | 68,87 % | 64,87 % |
| ZALA | 70,74 % | 67,42 % | 63,54 % |