| Updated: 17:58 10.3.2010 | General local governmental elections, 2010 | October 3, 2010 |
Informative Data on the Number and Proportion of Voters who have Turned out until 5 30 p.m.
| Nationally | ||
| Local Governmental Elections, 2002 | Local Governmental Elections, 2006 | Local Governmental Elections, 2010 |
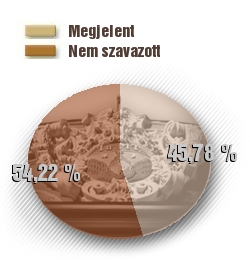
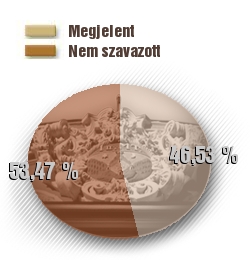
| 45,78 % | 46,53 % | 41,77 % |
 |
 |
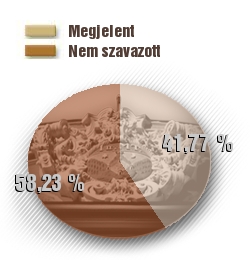 |
The light brown colour in the diagram represents the proportion of those who have turned out at the elections and
the dark brown colour the proportion of those who have not voted yet.
| Capital/county | Local Governmental Elections, 2002 | Local Governmental Elections, 2006 | Local Governmental Elections, 2010 |
|---|---|---|---|
| Budapest | 46,61 % | 48,10 % | 37,91 % |
| Baranya | 47,24 % | 47,87 % | 41,22 % |
| Bács-Kiskun | 42,00 % | 43,29 % | 38,34 % |
| Békés | 43,64 % | 45,56 % | 42,20 % |
| Borsod-Abaúj-Zemplén | 47,86 % | 48,23 % | 48,41 % |
| Csongrád | 42,49 % | 42,67 % | 41,80 % |
| Fejér | 43,41 % | 44,12 % | 40,27 % |
| Győr-Moson-Sopron | 47,83 % | 47,87 % | 41,16 % |
| Hajdú-Bihar | 41,95 % | 44,41 % | 38,06 % |
| Heves | 47,09 % | 47,06 % | 47,57 % |
| Jász-Nagykun-Szolnok | 45,11 % | 44,11 % | 40,88 % |
| Komárom-Esztergom | 43,15 % | 42,53 % | 39,56 % |
| Nógrád | 48,62 % | 50,37 % | 48,62 % |
| Pest | 43,98 % | 44,83 % | 39,31 % |
| Somogy | 49,75 % | 49,76 % | 45,78 % |
| Szabolcs-Szatmár-Bereg | 48,86 % | 51,38 % | 50,56 % |
| Tolna | 46,85 % | 47,18 % | 42,81 % |
| Vas | 49,11 % | 48,05 % | 46,15 % |
| Veszprém | 47,66 % | 46,17 % | 41,77 % |
| Zala | 45,80 % | 46,09 % | 41,79 % |