| Updated: 2014.05.25. 17:30 |
THE ELECTION OF THE MEMBERS OF THE EUROPEAN PARLIAMENT
25 May 2014 |
|
Informative data on until 5 p.m.
At domestic electoral districts
 |
|
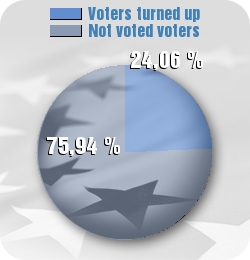
24,06 % of voters turned out |
| 75,94 % of voters didn't turn out |
The proportion of voters turned out until at domestic electoral districts 5 p.m. on the 2014 parliamentary election 56,77 %
Comparative data on the previous EP and
the 2014 parliamentary election
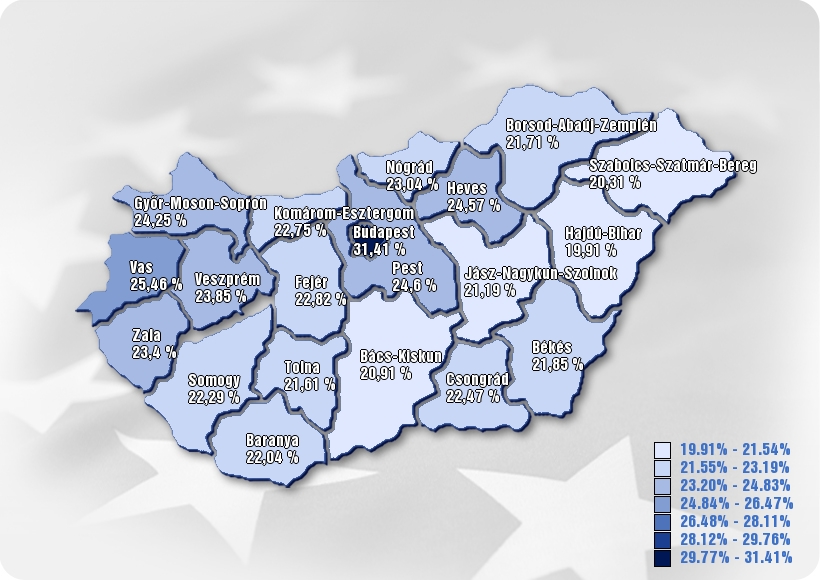
Capital/County
| County |
Number of voters |
Number of voters turned out |
Turnout % |
| Total |
8 033 814 |
1 932 738 |
24,06 % |
| BUDAPEST |
1 352 267 |
424 686 |
31.41 % |
| BARANYA |
316 144 |
69 673 |
22.04 % |
| BÁCS–KISKUN |
429 031 |
89 707 |
20.91 % |
| BÉKÉS |
298 853 |
65 296 |
21.85 % |
| BORSOD–ABAÚJ–ZEMPLÉN |
550 902 |
119 606 |
21.71 % |
| CSONGRÁD |
339 676 |
76 337 |
22.47 % |
| FEJÉR |
347 180 |
79 213 |
22.82 % |
| GYŐR–MOSON–SOPRON |
359 835 |
87 257 |
24.25 % |
| HAJDÚ–BIHAR |
435 897 |
86 772 |
19.91 % |
| HEVES |
249 505 |
61 306 |
24.57 % |
| JÁSZ–NAGYKUN–SZOLNOK |
316 659 |
67 099 |
21.19 % |
| KOMÁROM–ESZTERGOM |
250 653 |
57 024 |
22.75 % |
| NÓGRÁD |
164 970 |
38 006 |
23.04 % |
| PEST |
979 658 |
240 964 |
24.6 % |
| SOMOGY |
262 370 |
58 494 |
22.29 % |
| SZABOLCS–SZATMÁR–BEREG |
450 614 |
91 534 |
20.31 % |
| TOLNA |
190 847 |
41 246 |
21.61 % |
| VAS |
210 318 |
53 551 |
25.46 % |
| VESZPRÉM |
295 030 |
70 361 |
23.85 % |
| ZALA |
233 405 |
54 606 |
23.4 % |