| Updated: 2014.05.25. 15:40 |
THE ELECTION OF THE MEMBERS OF THE EUROPEAN PARLIAMENT
25 May 2014 |
|
Informative data on until 3 p.m.
At domestic electoral districts
 |
|
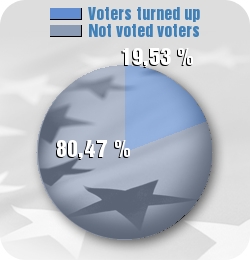
19,53 % of voters turned out |
| 80,47 % of voters didn't turn out |
The proportion of voters turned out until at domestic electoral districts 3 p.m. on the 2014 parliamentary election 45,02 %
Comparative data on the previous EP and
the 2014 parliamentary election
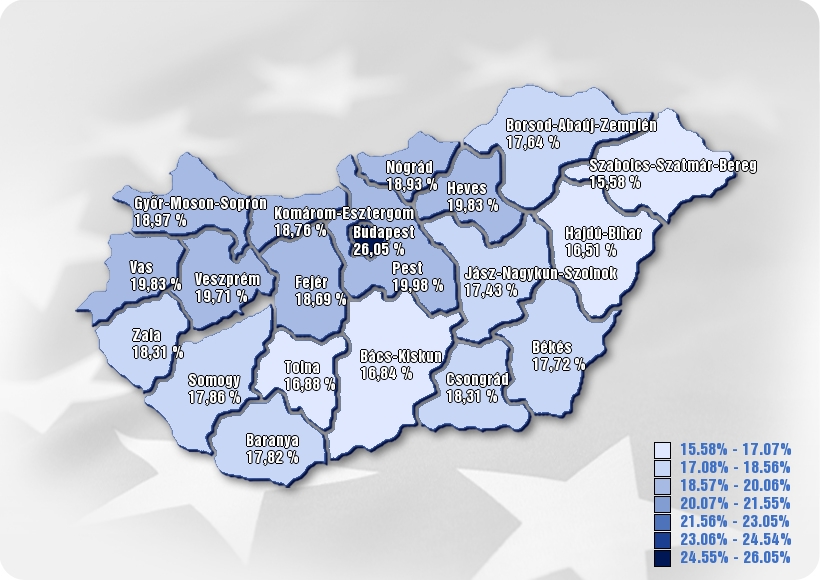
Capital/County
| County |
Number of voters |
Number of voters turned out |
Turnout % |
| Total |
8 033 814 |
1 568 872 |
19,53 % |
| BUDAPEST |
1 352 267 |
352 290 |
26.05 % |
| BARANYA |
316 144 |
56 336 |
17.82 % |
| BÁCS–KISKUN |
429 031 |
72 244 |
16.84 % |
| BÉKÉS |
298 853 |
52 943 |
17.72 % |
| BORSOD–ABAÚJ–ZEMPLÉN |
550 902 |
97 191 |
17.64 % |
| CSONGRÁD |
339 676 |
62 184 |
18.31 % |
| FEJÉR |
347 180 |
64 872 |
18.69 % |
| GYŐR–MOSON–SOPRON |
359 835 |
68 243 |
18.97 % |
| HAJDÚ–BIHAR |
435 897 |
71 988 |
16.51 % |
| HEVES |
249 505 |
49 481 |
19.83 % |
| JÁSZ–NAGYKUN–SZOLNOK |
316 659 |
55 209 |
17.43 % |
| KOMÁROM–ESZTERGOM |
250 653 |
47 018 |
18.76 % |
| NÓGRÁD |
164 970 |
31 235 |
18.93 % |
| PEST |
979 658 |
195 762 |
19.98 % |
| SOMOGY |
262 370 |
46 850 |
17.86 % |
| SZABOLCS–SZATMÁR–BEREG |
450 614 |
70 221 |
15.58 % |
| TOLNA |
190 847 |
32 213 |
16.88 % |
| VAS |
210 318 |
41 711 |
19.83 % |
| VESZPRÉM |
295 030 |
58 140 |
19.71 % |
| ZALA |
233 405 |
42 741 |
18.31 % |