| Updated: 2014.05.25. 13:36 |
THE ELECTION OF THE MEMBERS OF THE EUROPEAN PARLIAMENT
25 May 2014 |
|
Informative data on until 1 p.m.
At domestic electoral districts
 |
|
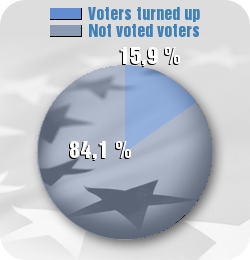
15,90 % of voters turned out |
| 84,10 % of voters didn't turn out |
The proportion of voters turned out until at domestic electoral districts 1 p.m. on the 2014 parliamentary election 34,33 %
Comparative data on the previous EP and
the 2014 parliamentary election
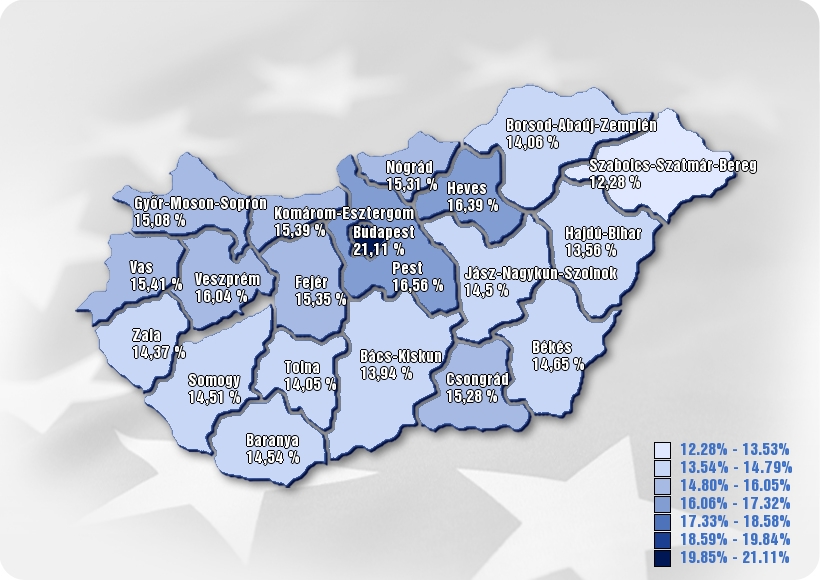
Capital/County
| County |
Number of voters |
Number of voters turned out |
Turnout % |
| Total |
8 033 814 |
1 277 333 |
15,90 % |
| BUDAPEST |
1 352 267 |
285 436 |
21.11 % |
| BARANYA |
316 144 |
45 953 |
14.54 % |
| BÁCS–KISKUN |
429 031 |
59 787 |
13.94 % |
| BÉKÉS |
298 853 |
43 771 |
14.65 % |
| BORSOD–ABAÚJ–ZEMPLÉN |
550 902 |
77 455 |
14.06 % |
| CSONGRÁD |
339 676 |
51 897 |
15.28 % |
| FEJÉR |
347 180 |
53 285 |
15.35 % |
| GYŐR–MOSON–SOPRON |
359 835 |
54 253 |
15.08 % |
| HAJDÚ–BIHAR |
435 897 |
59 090 |
13.56 % |
| HEVES |
249 505 |
40 896 |
16.39 % |
| JÁSZ–NAGYKUN–SZOLNOK |
316 659 |
45 903 |
14.5 % |
| KOMÁROM–ESZTERGOM |
250 653 |
38 569 |
15.39 % |
| NÓGRÁD |
164 970 |
25 253 |
15.31 % |
| PEST |
979 658 |
162 262 |
16.56 % |
| SOMOGY |
262 370 |
38 062 |
14.51 % |
| SZABOLCS–SZATMÁR–BEREG |
450 614 |
55 354 |
12.28 % |
| TOLNA |
190 847 |
26 821 |
14.05 % |
| VAS |
210 318 |
32 417 |
15.41 % |
| VESZPRÉM |
295 030 |
47 329 |
16.04 % |
| ZALA |
233 405 |
33 540 |
14.37 % |