| Updated: 2014.05.25. 11:28 |
THE ELECTION OF THE MEMBERS OF THE EUROPEAN PARLIAMENT
25 May 2014 |
|
Informative data on until 11 a.m.
At domestic electoral districts
 |
|
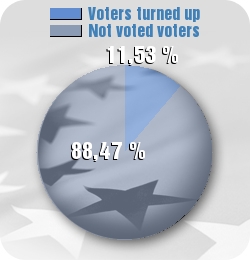
11,53 % of voters turned out |
| 88,47 % of voters didn't turn out |
The proportion of voters turned out until at domestic electoral districts 11 a.m. on the 2014 parliamentary election 23,23 %
Comparative data on the previous EP and
the 2014 parliamentary election
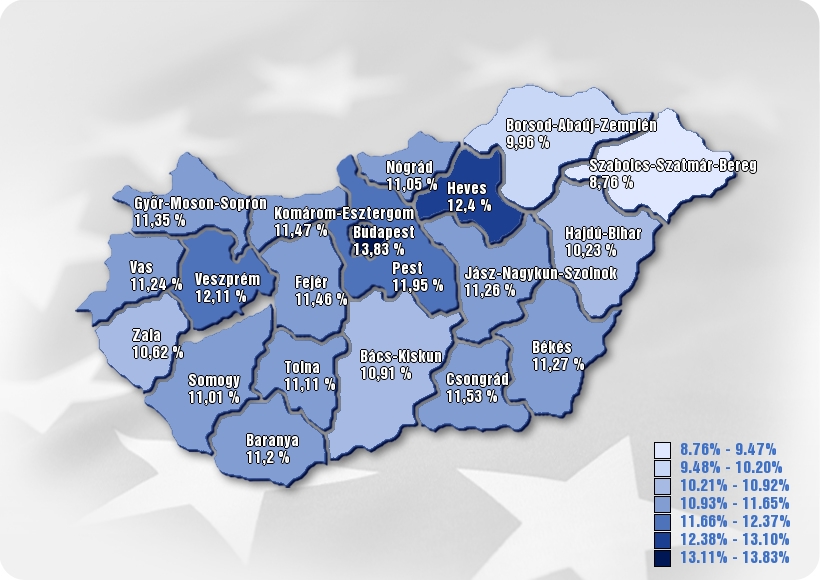
Capital/County
| County |
Number of voters |
Number of voters turned out |
Turnout % |
| Total |
8 033 814 |
926 578 |
11,53 % |
| BUDAPEST |
1 352 267 |
187 058 |
13.83 % |
| BARANYA |
316 144 |
35 417 |
11.2 % |
| BÁCS–KISKUN |
429 031 |
46 825 |
10.91 % |
| BÉKÉS |
298 853 |
33 686 |
11.27 % |
| BORSOD–ABAÚJ–ZEMPLÉN |
550 902 |
54 856 |
9.96 % |
| CSONGRÁD |
339 676 |
39 157 |
11.53 % |
| FEJÉR |
347 180 |
39 799 |
11.46 % |
| GYŐR–MOSON–SOPRON |
359 835 |
40 834 |
11.35 % |
| HAJDÚ–BIHAR |
435 897 |
44 571 |
10.23 % |
| HEVES |
249 505 |
30 943 |
12.4 % |
| JÁSZ–NAGYKUN–SZOLNOK |
316 659 |
35 671 |
11.26 % |
| KOMÁROM–ESZTERGOM |
250 653 |
28 747 |
11.47 % |
| NÓGRÁD |
164 970 |
18 225 |
11.05 % |
| PEST |
979 658 |
117 071 |
11.95 % |
| SOMOGY |
262 370 |
28 876 |
11.01 % |
| SZABOLCS–SZATMÁR–BEREG |
450 614 |
39 483 |
8.76 % |
| TOLNA |
190 847 |
21 200 |
11.11 % |
| VAS |
210 318 |
23 640 |
11.24 % |
| VESZPRÉM |
295 030 |
35 721 |
12.11 % |
| ZALA |
233 405 |
24 798 |
10.62 % |