| Updated: 2014.05.25. 09:26 |
THE ELECTION OF THE MEMBERS OF THE EUROPEAN PARLIAMENT
25 May 2014 |
|
Informative data on until 9 a.m.
At domestic electoral districts
 |
|
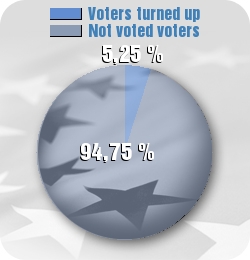
5,25 % of voters turned out |
| 94,75 % of voters didn't turn out |
The proportion of voters turned out until at domestic electoral districts 9 a.m. on the 2014 parliamentary election 9,50 %
Comparative data on the previous EP and
the 2014 parliamentary election
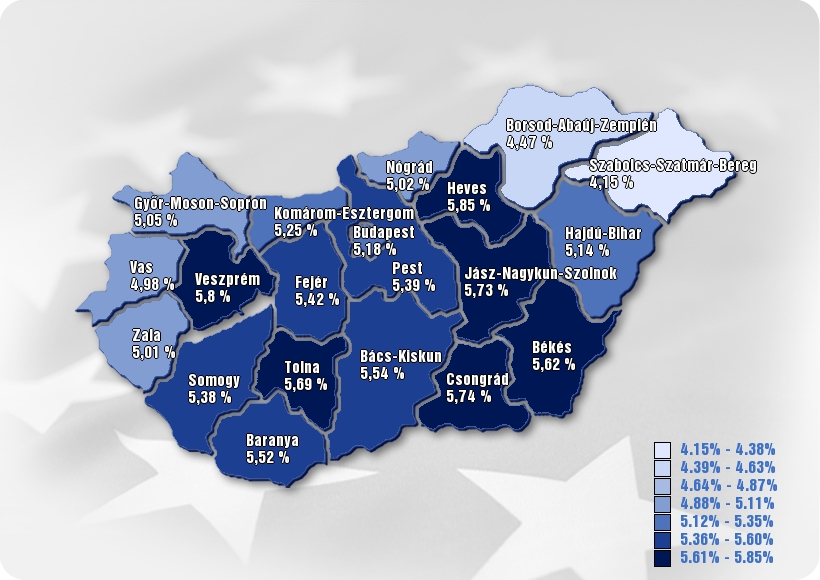
Capital/County
| County |
Number of voters |
Number of voters turned out |
Turnout % |
| Total |
8 033 814 |
421 500 |
5,25 % |
| BUDAPEST |
1 352 267 |
70 008 |
5.18 % |
| BARANYA |
316 144 |
17 458 |
5.52 % |
| BÁCS–KISKUN |
429 031 |
23 750 |
5.54 % |
| BÉKÉS |
298 853 |
16 801 |
5.62 % |
| BORSOD–ABAÚJ–ZEMPLÉN |
550 902 |
24 626 |
4.47 % |
| CSONGRÁD |
339 676 |
19 503 |
5.74 % |
| FEJÉR |
347 180 |
18 818 |
5.42 % |
| GYŐR–MOSON–SOPRON |
359 835 |
18 157 |
5.05 % |
| HAJDÚ–BIHAR |
435 897 |
22 426 |
5.14 % |
| HEVES |
249 505 |
14 594 |
5.85 % |
| JÁSZ–NAGYKUN–SZOLNOK |
316 659 |
18 146 |
5.73 % |
| KOMÁROM–ESZTERGOM |
250 653 |
13 160 |
5.25 % |
| NÓGRÁD |
164 970 |
8 280 |
5.02 % |
| PEST |
979 658 |
52 799 |
5.39 % |
| SOMOGY |
262 370 |
14 123 |
5.38 % |
| SZABOLCS–SZATMÁR–BEREG |
450 614 |
18 717 |
4.15 % |
| TOLNA |
190 847 |
10 854 |
5.69 % |
| VAS |
210 318 |
10 468 |
4.98 % |
| VESZPRÉM |
295 030 |
17 116 |
5.8 % |
| ZALA |
233 405 |
11 696 |
5.01 % |