| Updated: 2014.05.25. 07:25 |
THE ELECTION OF THE MEMBERS OF THE EUROPEAN PARLIAMENT
25 May 2014 |
|
Informative data on until 7 a.m.
At domestic electoral districts
 |
|
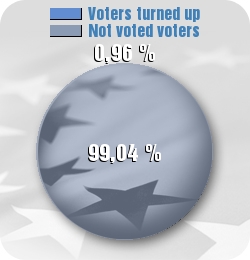
0,96 % of voters turned out |
| 99,04 % of voters didn't turn out |
The proportion of voters turned out until at domestic electoral districts 7 a.m. on the 2014 parliamentary election 1,64 %
Comparative data on the previous EP and
the 2014 parliamentary election
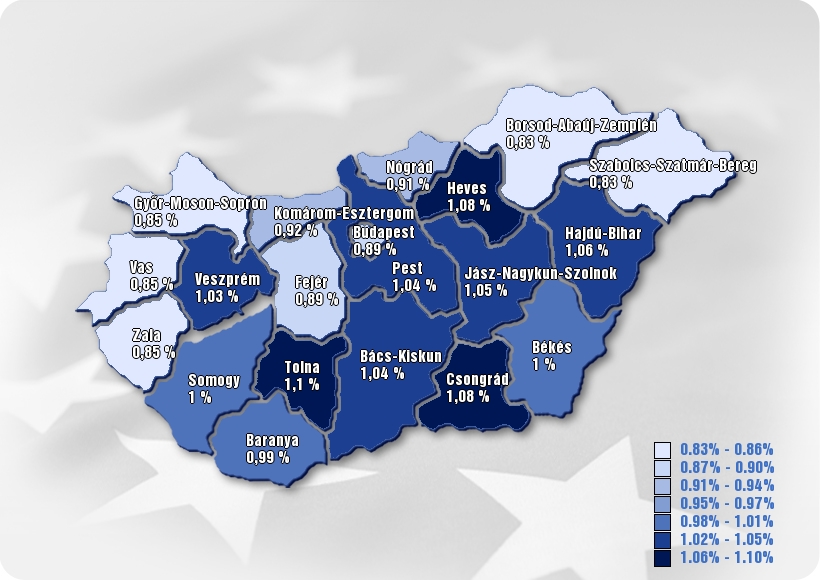
Capital/County
| County |
Number of voters |
Number of voters turned out |
Turnout % |
| Total |
8 033 814 |
76 923 |
0,96 % |
| BUDAPEST |
1 352 267 |
12 009 |
0.89 % |
| BARANYA |
316 144 |
3 145 |
0.99 % |
| BÁCS–KISKUN |
429 031 |
4 449 |
1.04 % |
| BÉKÉS |
298 853 |
2 984 |
1.0 % |
| BORSOD–ABAÚJ–ZEMPLÉN |
550 902 |
4 576 |
0.83 % |
| CSONGRÁD |
339 676 |
3 669 |
1.08 % |
| FEJÉR |
347 180 |
3 107 |
0.89 % |
| GYŐR–MOSON–SOPRON |
359 835 |
3 075 |
0.85 % |
| HAJDÚ–BIHAR |
435 897 |
4 599 |
1.06 % |
| HEVES |
249 505 |
2 706 |
1.08 % |
| JÁSZ–NAGYKUN–SZOLNOK |
316 659 |
3 327 |
1.05 % |
| KOMÁROM–ESZTERGOM |
250 653 |
2 309 |
0.92 % |
| NÓGRÁD |
164 970 |
1 496 |
0.91 % |
| PEST |
979 658 |
10 199 |
1.04 % |
| SOMOGY |
262 370 |
2 627 |
1.0 % |
| SZABOLCS–SZATMÁR–BEREG |
450 614 |
3 728 |
0.83 % |
| TOLNA |
190 847 |
2 098 |
1.1 % |
| VAS |
210 318 |
1 791 |
0.85 % |
| VESZPRÉM |
295 030 |
3 049 |
1.03 % |
| ZALA |
233 405 |
1 980 |
0.85 % |