| THE ELECTION OF THE MEMBERS OF THE EUROPEAN PARLIAMENT |
| 7 June 2009 |
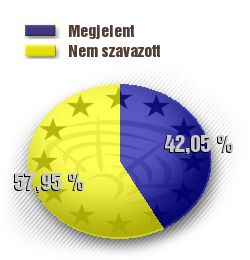
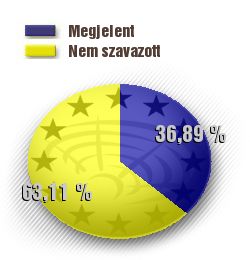
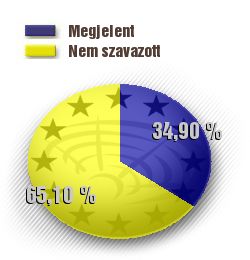
Comparative data on turnout until 6 30 p.m.
The exhibit contains comparative data on
the turnout at the 2003 Referendum on the accession to the European Union
the turnout at the 2004 European Parliamentary election
the turnout at the 2009 European Parliamentary election
The blue colour in the diagram represents the proportion of those who have turned out at the elections, and the yellow colour the proportion of those who have not voted yet.
| Nationally | ||
|---|---|---|
| 2003 EU Referendum (On the grounds of the report at 7:30 p.m.) | 2004 European Parliamentary election | 2009 European Parliamentary election |
| 42,05 % | 36,89 % | 34,90 % |
 |
 |
 |
| Capital/county | 2003 EU Referendum (On the grounds of the report at 7:30 p.m.) | 2004 European Parliamentary election | 2009 European Parliamentary election |
| Budapest | 52,10 % | 47,26 % | 42,66 % |
| Baranya | 45,19 % | 36,64 % | 31,15 % |
| Bács-Kiskun | 34,73 % | 32,80 % | 32,61 % |
| Békés | 38,10 % | 32,04 % | 31,60 % |
| Borsod-Abaúj-Zemplén | 39,16 % | 33,36 % | 31,87 % |
| Csongrád | 38,06 % | 34,79 % | 32,26 % |
| Fejér | 41,64 % | 35,16 % | 33,28 % |
| Győr-Moson-Sopron | 46,38 % | 41,54 % | 36,84 % |
| Hajdú-Bihar | 33,72 % | 30,33 % | 32,12 % |
| Heves | 41,71 % | 34,13 % | 33,49 % |
| Jász-Nagykun-Szolnok | 37,32 % | 30,71 % | 29,86 % |
| Komárom-Esztergom | 43,86 % | 35,83 % | 32,88 % |
| Nógrád | 39,52 % | 34,83 % | 34,50 % |
| Pest | 42,43 % | 36,84 % | 36,64 % |
| Somogy | 39,15 % | 33,81 % | 32,15 % |
| Szabolcs-Szatmár-Bereg | 32,76 % | 29,20 % | 31,10 % |
| Tolna | 39,88 % | 34,94 % | 33,00 % |
| Vas | 46,37 % | 40,87 % | 37,46 % |
| Veszprém | 44,67 % | 39,38 % | 34,34 % |
| Zala | 39,79 % | 37,07 % | 33,57 % |